It’s Not Strategy Without Metrics
Increase your influence by focusing on measurable outcomes instead of copious output
Welcome to the seventh edition of Full Stack Content. This week’s post is inspired by a subscriber who asked me, “How can I increase my influence at work?”
Let’s dive in.
—

Business writing is more science than art.
Writing is a creative act, but it also requires psychology, critical thinking, and professional judgment.
Content people are too often brought in at the end of the process and viewed as responsible for “the words on the page.” We don’t get enough credit for the headlines we write that capture attention. The descriptions we write help people understand the products our company sells. And it’s our words that drive people to action.
Our colleagues somehow fail to understand that the most important work we do happens before we write a single word.
I often find myself explaining that there is no such thing as a “quick copy pass.”
It would be nice if there were a place where I could just turn for great headlines and compelling CTAs. Alas, I don’t have a magical incantation for exemplary content.
Instead, this post offers methods you can use to understand context, readers, and expected outcomes. You can use this knowledge to write better copy and maximize your influence at work.
Outcomes Are More Important Than Output
Obviously, you’re going to write words. That’s the output of your effort.
More importantly, the words you write drive business outcomes. Leaders report those outcomes through metrics.
If you want to succeed in business writing, then you need to appreciate metrics even if you’re not responsible for reporting them.
As a reminder, here is the definition of content strategy.
Content strategy plans for the creation, publication, and governance of useful, usable content.
Maybe you’re not a “numbers person.” So what. Metrics are an essential part of governance.
I don’t care if they didn’t teach you metrics in journalism school. It doesn’t matter if you didn’t learn about qualitative and quantitative research methods in your degree program. Appreciating these metrics is a fundamental part of your job as a business writer.
Here’s the good news. The marketers, designers, product managers, engineers, and executives on your team probably have a handle on the metrics. So, your job is simply to engage your colleagues in a conversation to ensure you understand how success will be measured.
When you shift your focus from outputs to outcomes, it doesn’t matter if you wrote 10 words or 10,000 words. What matters is that your words produce the expected result. Then you can take the afternoon off. 😎
Psst: Tell Me About Your Content Team
I’m doing some research for an upcoming article about the organization of content teams. Please take a couple of minutes to answer these seven questions.
Setting Goals and Choosing Content Metrics
A user research team at Google developed the Goals-Signals-Metrics process. You can use this simple three-step approach to elevate the conversation from the words you write to the impact those words will have.

If you want some help facilitating this conversation, check out this step-by-step guide by Atlassian, which will show you how to run this exercise in about 90 minutes.
Step 1: Prioritize Goals
Because teams are a collection of individuals, you shouldn’t assume everyone is on the same page. Each person brings their own priorities and context. You must engage people in a dialogue to align on the specific goals of your writing assignment.
If you don’t align on the goals first, it will be impossible to choose the correct metric. Not to mention, the review and editing process will be more difficult later.
Step 2: Identify Signals
After your team has aligned on the goals, the next step is to identify signals that indicate success or failure toward that goal.
Think about both the quantitative and qualitative data sources that are available. User actions, such as a purchase or signup, could be tracked in analytics. User attitudes, such as preference or perceived ease-of-use, could be measured through surveys or interviews.
The best signals indicate whether or not the goal is successfully met or not. Sometimes it’s easier to identify failure than success. So, be sure to consider both sides of the equation.
Step 3: Choose Content Metrics
The final step in the process is to translate those signals into specific metrics.
Here are five techniques for choosing metrics:
Compare the results from two user groups (cohort analysis).
Use percentage instead of raw counts (relative change).
Measure rates instead of totals (change over time).
Averages instead of totals (per user average).
Counts of unique users instead of totals (unique user count).
Here’s the big takeaway: the metrics you choose to measure content performance should align with your product and marketing metrics.
Sorry that I didn’t say that sooner. I wanted to equip you with the tools to have the conversation rather than encourage you to delegate the responsibility.
Inevitably, someone will pull you in at the last moment for a “quick pass at the copy.”
Now you have a process to facilitate a meaningful conversation. Having this conversation will help you explain your decisions and how they will influence the desired outcome.
There is less ego involved when everyone focuses on the outcome.
Clear outcomes make the editing process smoother.
Smoother processes result in a happier team.
Data Types and Collection Methods
There are myriad types of data and ways to measure the user experience (of which content makes up a huge part).
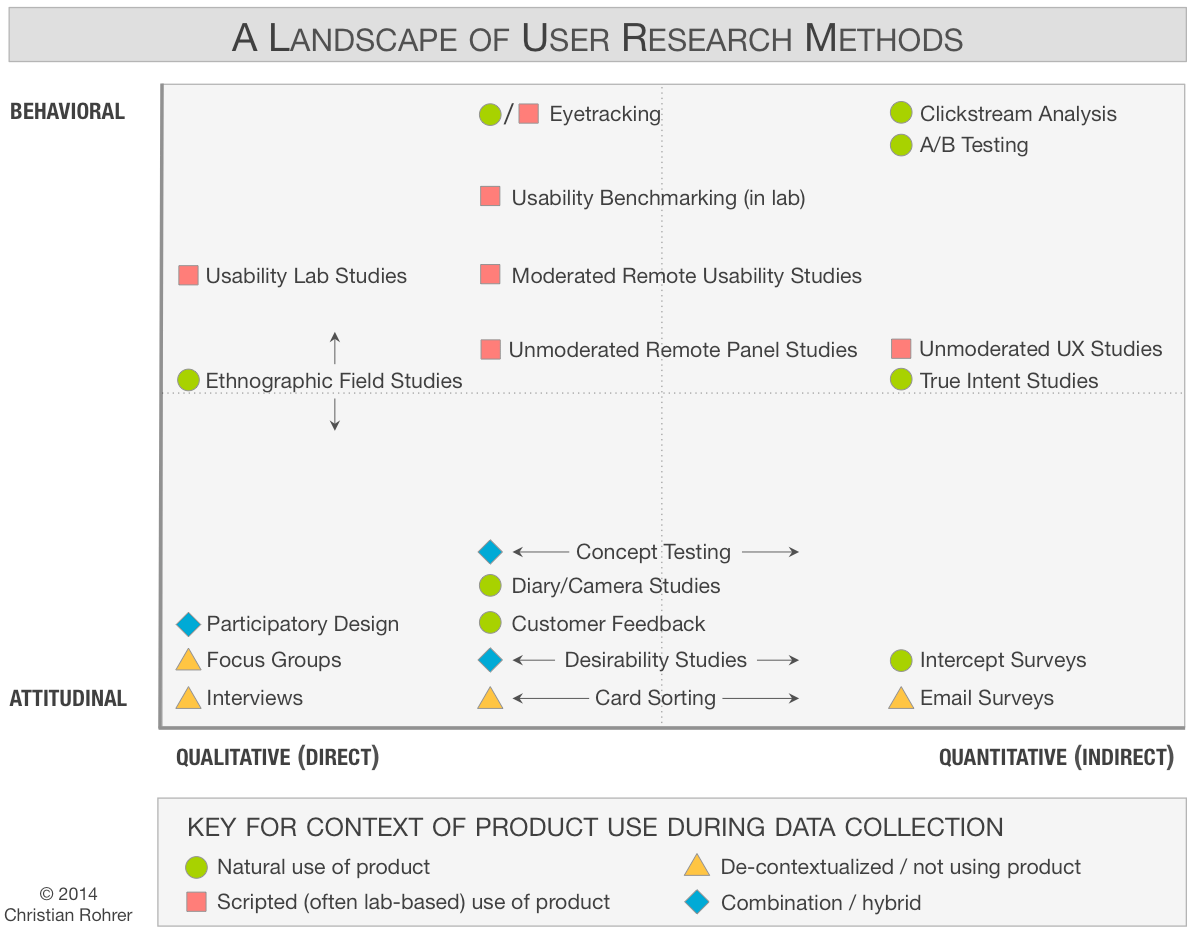
Attitudinal data is what people say.
Behavioral data is what people do.
Qualitative methods collect data through direct observation.
Quantitative methods collect data through indirect observation.
Using every method is not realistic. This user research methods landscape by Nielsen Norman Group is a helpful tool.

To choose the best method for your situation, consider the type of data you need to collect.
Quantitative methods measure how many and how much. These methods can help understand where a problem exists but are not very helpful at understanding the root cause.
Qualitative methods measure why something is a problem and can help identify possible solutions. These methods can help you understand the root cause; they are resource-intensive and can lead to anomalous findings.
“Mixed methods” offer the best of both worlds. Use a combination of methods to understand performance and how it can be improved.
Qualitative Methods
Qualitative methods are great for collecting attitudinal data.
Impression
Understanding
Preference
Ease of Use
There is a misconception that these “soft data” are not measurable. Because these data are unstructured, it is challenging to report insights in a numerical way. Even still, it is possible to measure these dimensions using the following qualitative methods.
1. Heuristic Evaluations
A heuristic evaluation is an expert review of a product that relies on best practices (or rules of thumb) to highlight opportunities for improvement. Consult - these - popular - checklists to create a scorecard that’s perfect for your situation.
When to use this method: Use this method when you’re short on time or want to tweak something that already exists. Depending on whom you’re presenting to, you may need to explain heuristics or rationalize each rule.
2. Sentence Completion
Sentence completion tests measure attitudes, motivations, or beliefs by asking users to “fill in the blank” at the beginning or end of a sentence. This method is just like the Madlib games you played as a kid.
When to use this method: Use this method when you want to understand if the information presented is clear to users; or if it makes the right impression on them. It’s best to use a mix of positive and negative statements.
3. Reaction Cards
Developed in 2002 by Microsoft, reaction cards measure the emotional response or desirability by having users select from a list of words. The original Microsoft list had 118 words.
When to use this method: Use this method for new or existing experiences. Because it uses a fixed set of words, you can tabulate the results and present them numerically.
Quantitative Methods
Quantitative methods produce data that is structured. Although it’s easy to tabulate, this data is hard to interpret without a reference point. Thus, quantitative methods are best for comparing to something like a previous benchmark or industry standard.
Statistical techniques prevent anomalous results from skewing your perspective. If there’s no analyst on your team, then I recommend consulting someone to help you design quantitative studies to understand the margin of error and how much you can trust the results from one study.
1. Surveys
A survey gathers data from people through a set of structured questions. Surveys allow you to draw conclusions and generalize the results to a larger population.
When to use this method: Use this method when you want to collect data from an individual about their experience. Email and in-session intercepts are popular forms of survey delivery.
Speaking of Surveys
Help me with a future post by answering a few questions about the structure of your team.
2. Analytics
Analytics tracks how a user navigates through a website or software product by recording their path and interactions. Analytics is often referred to as clickstream data or product telemetry data.
When to use this method: Use this method on existing products when you want to understand what users do on their own. For even better insights, segment data into cohorts based on traits to learn how user groups behave differently.
3. A/B Testing
A/B testing compares the performance of two (or more) options by randomly assigning users to interact with one variation. A/B testing allows you to measure the effect of different choices on user behavior.
When to use this method: Use this method when you have multiple hypotheses about how to achieve a goal. A/B testing is a popular method for optimizing digital marketing, purchase flows, and user onboarding.
Outcomes Lead to Influence
As I said earlier, business writing is more science than art.
While the words you write are a creative act, they’re not a form of self-expression. On the contrary, business writing is supposed to drive measurable outcomes.
When you understand the desired outcome, your copy is better.
When you measure the outcome, your impact is more evident.
When you report the results, your influence grows.
Support This Blog
These books informed this week’s post. As an Amazon Associate, I earn a small commission from qualifying purchases.
“Observing the User Experience” by Elizabeth Goodman, Ph.D.
“Understanding Your Users” by Kathy Baxter, Catherine Courage, and Kelly Caine
“A/B Testing: The Most Powerful Way to Turn Clicks Into Customers” by Dan Siroker and Pete Koomen
“Content Strategy for the Web” by Kristina Halvorson and Melissa Rach
Join Me at the Product-Led Summit
My next talk Use Science to Write Better Copy and Acquire More Customers will premiere at the Product-Led Summit (July 27–31, 2020).
This talk explores science-backed frameworks to:
Identify what your users need.
Organize your landing page.
Write copy that motivates users.
This session is perfect for anyone who wants to learn a rigorous (but not overwhelming) approach to writing ad copy and designing landing pages.
If you can’t afford the $99 ticket, then email contentstrategy@substack.com, and I’ll see what I can do.
Thanks for making it to the end! Please like this edition of Full Stack Content by clicking the ❤️ below, which helps the algorithms and encourages more people to read.
By the way, we’re on Instagram at @fullstackcontent in case that’s your jam. You can email us corrections/feedback at contentstrategy@substack.com.


